
Tag: data visualization
-
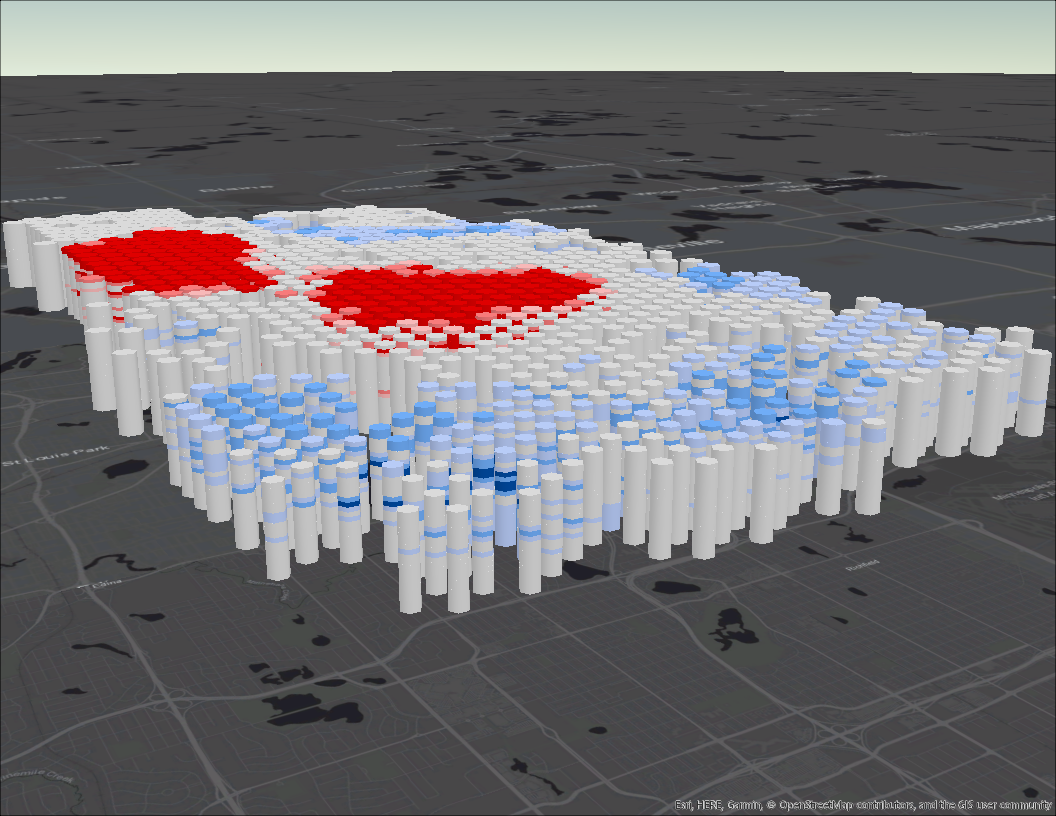
Analyzing Fires in Minneapolis Across Space and Time
After recently attending the Esri UC and listening to many sessions about spatial analysis, I have been inspired to test what I’ve learned. The City of Minneapolis where I currently live has an excellent open data portal, just waiting for GIS nerds like me to download and have some fun. Now I will walk you…
-
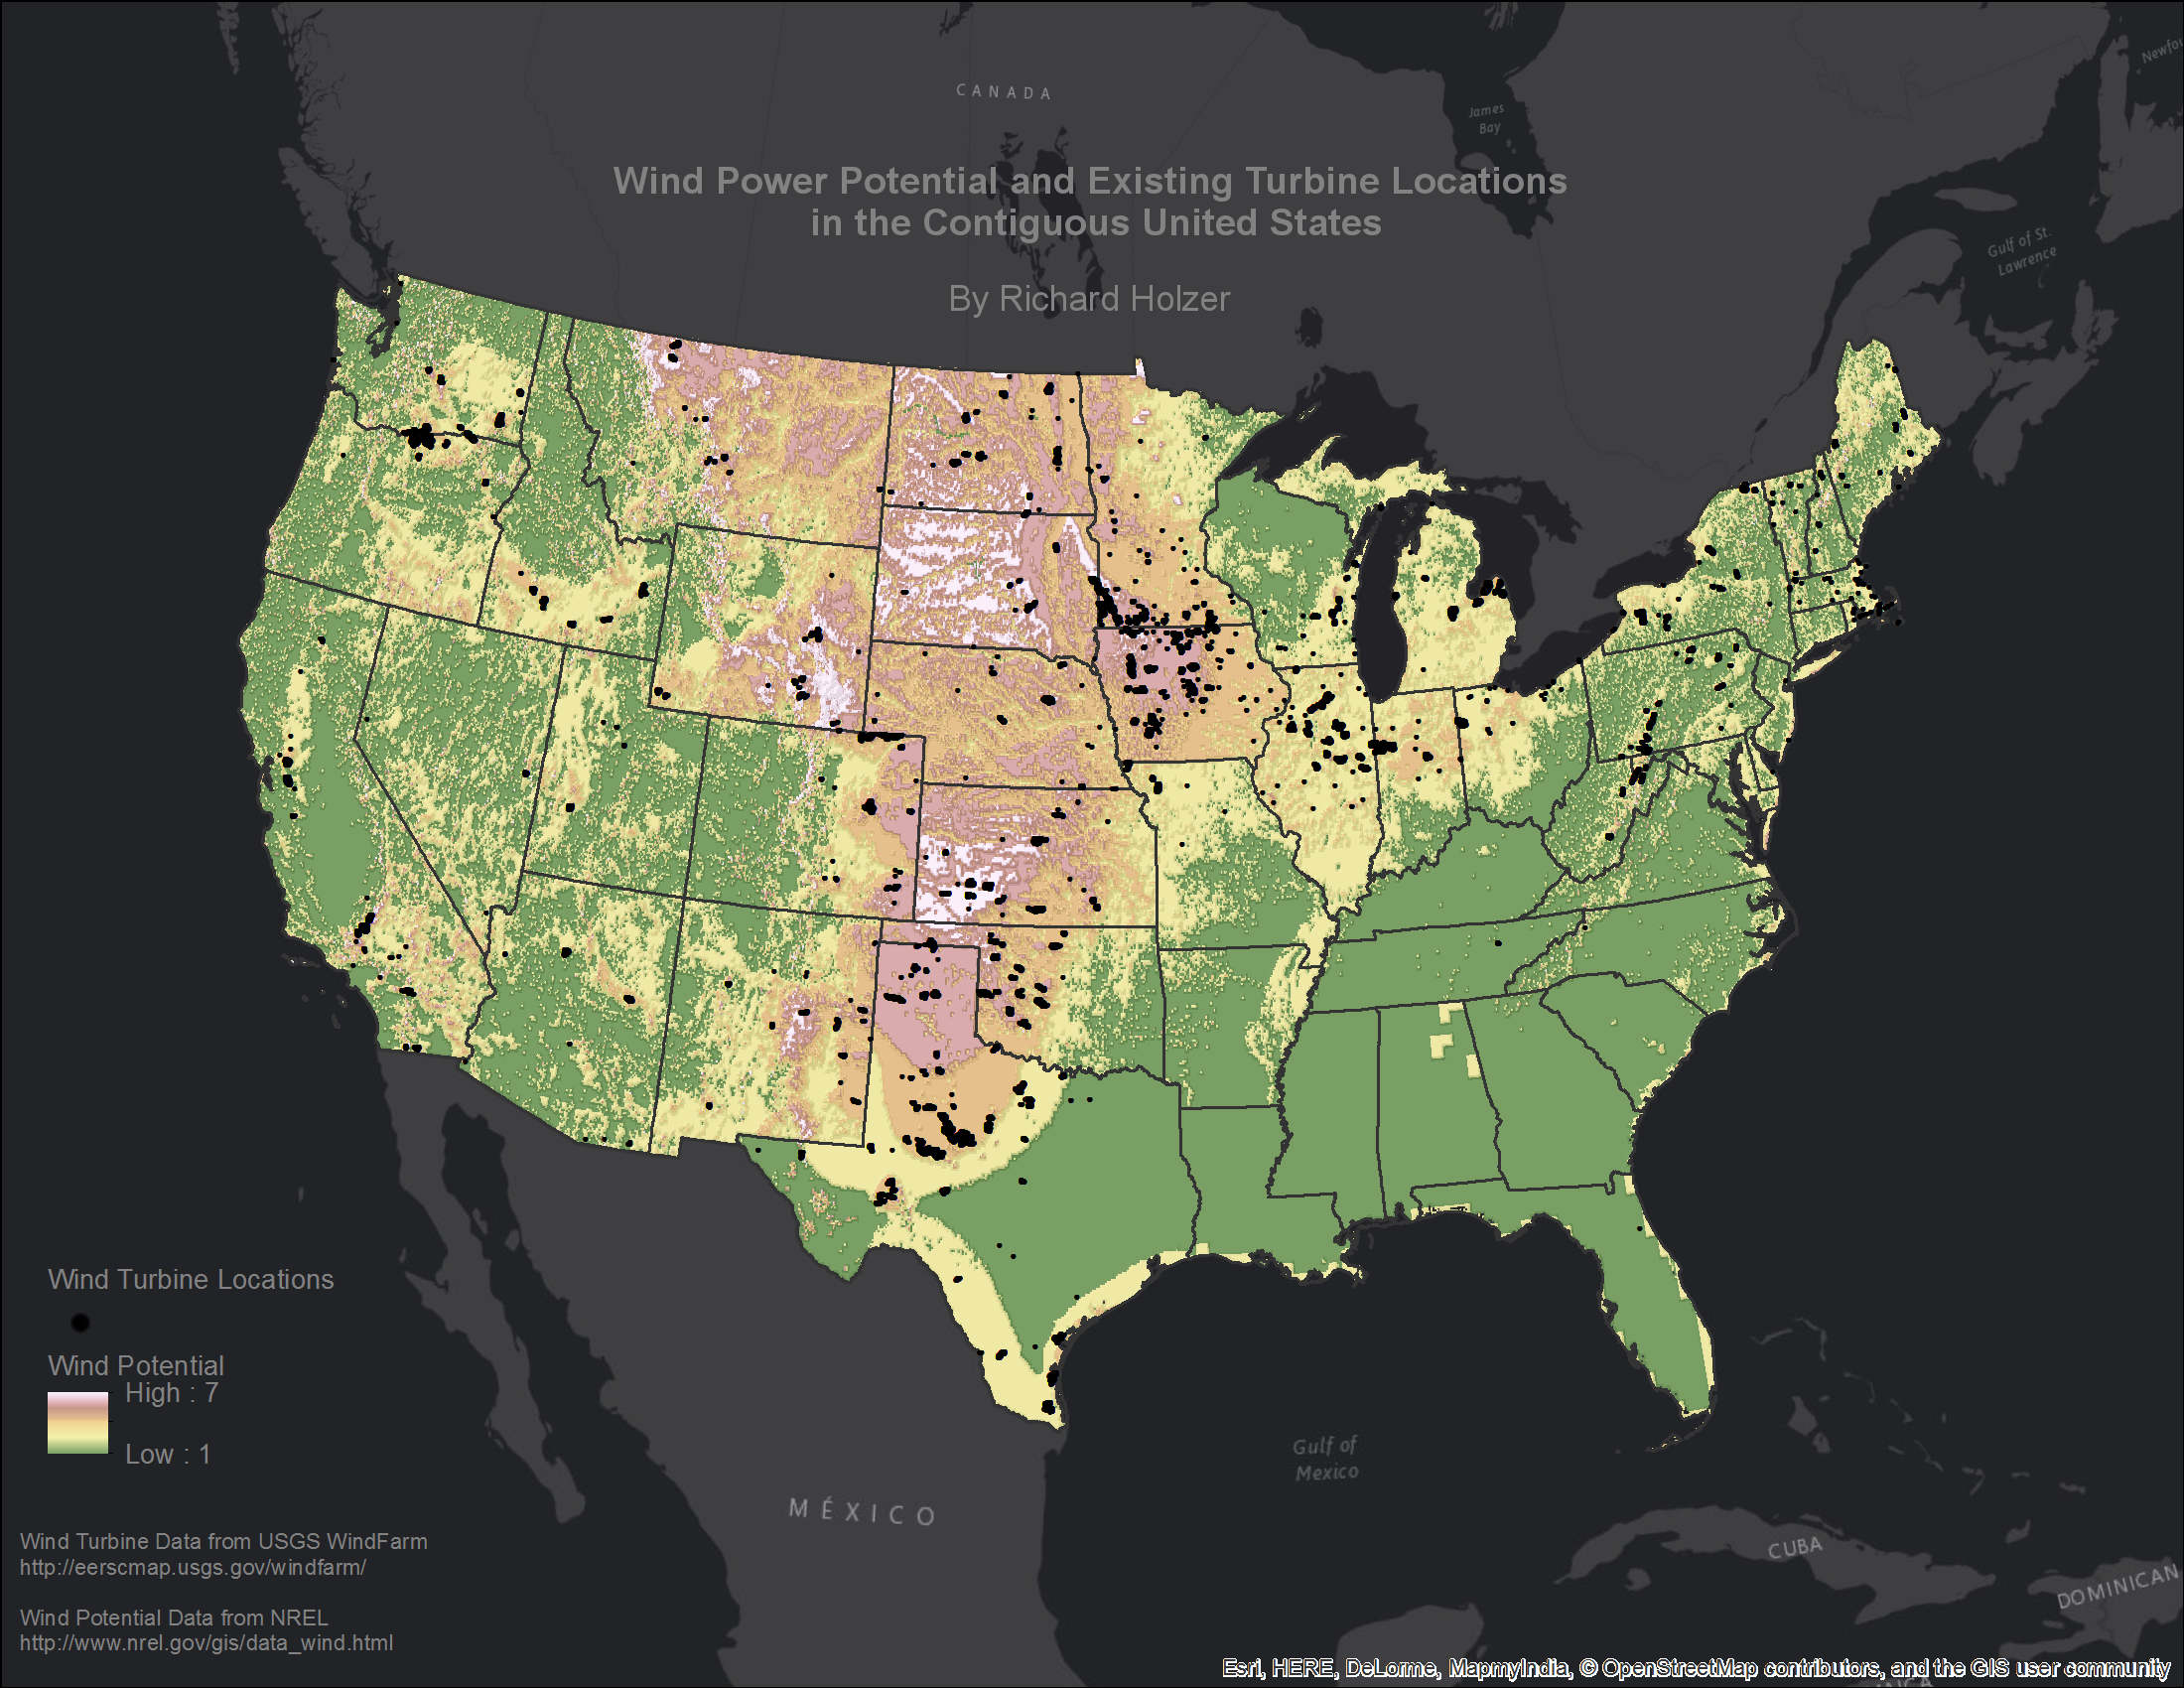
Mapping Wind Power in the US
I remember being amazed looking out the car windows at the wind farms in the Coachella Valley as a child, watching the otherworldly beauty of these giant structures spinning in unity during the day or the UFO-like field of blinking of red lights at night. I have been admiring the work of John Nelson since…
-
Visualizing the growth of the Minneapolis – St. Paul bikeshare program 2010-2015
As the #1 bike friendly city, you won’t be surprised to see the growth of the Nice Ride bikeshare program in Minneapolis. Visualizing the change over time is difficult to do using a static map, so I opted for animation to really show the expanding network and increase in trips. I present to you my…