
Category: Blog
-
Analyzing Pedestrian Accessibility Using QGIS and OpenStreetMaps Data
Current transportation planning practices are shifting toward a focus on accessibility – the ease in which a person can reach destinations given the available transportation network – for all modes of transportation including walking, bicycling, and using public transit. This article will explain different methods of measuring accessibility and how to adapt those methods for…
-
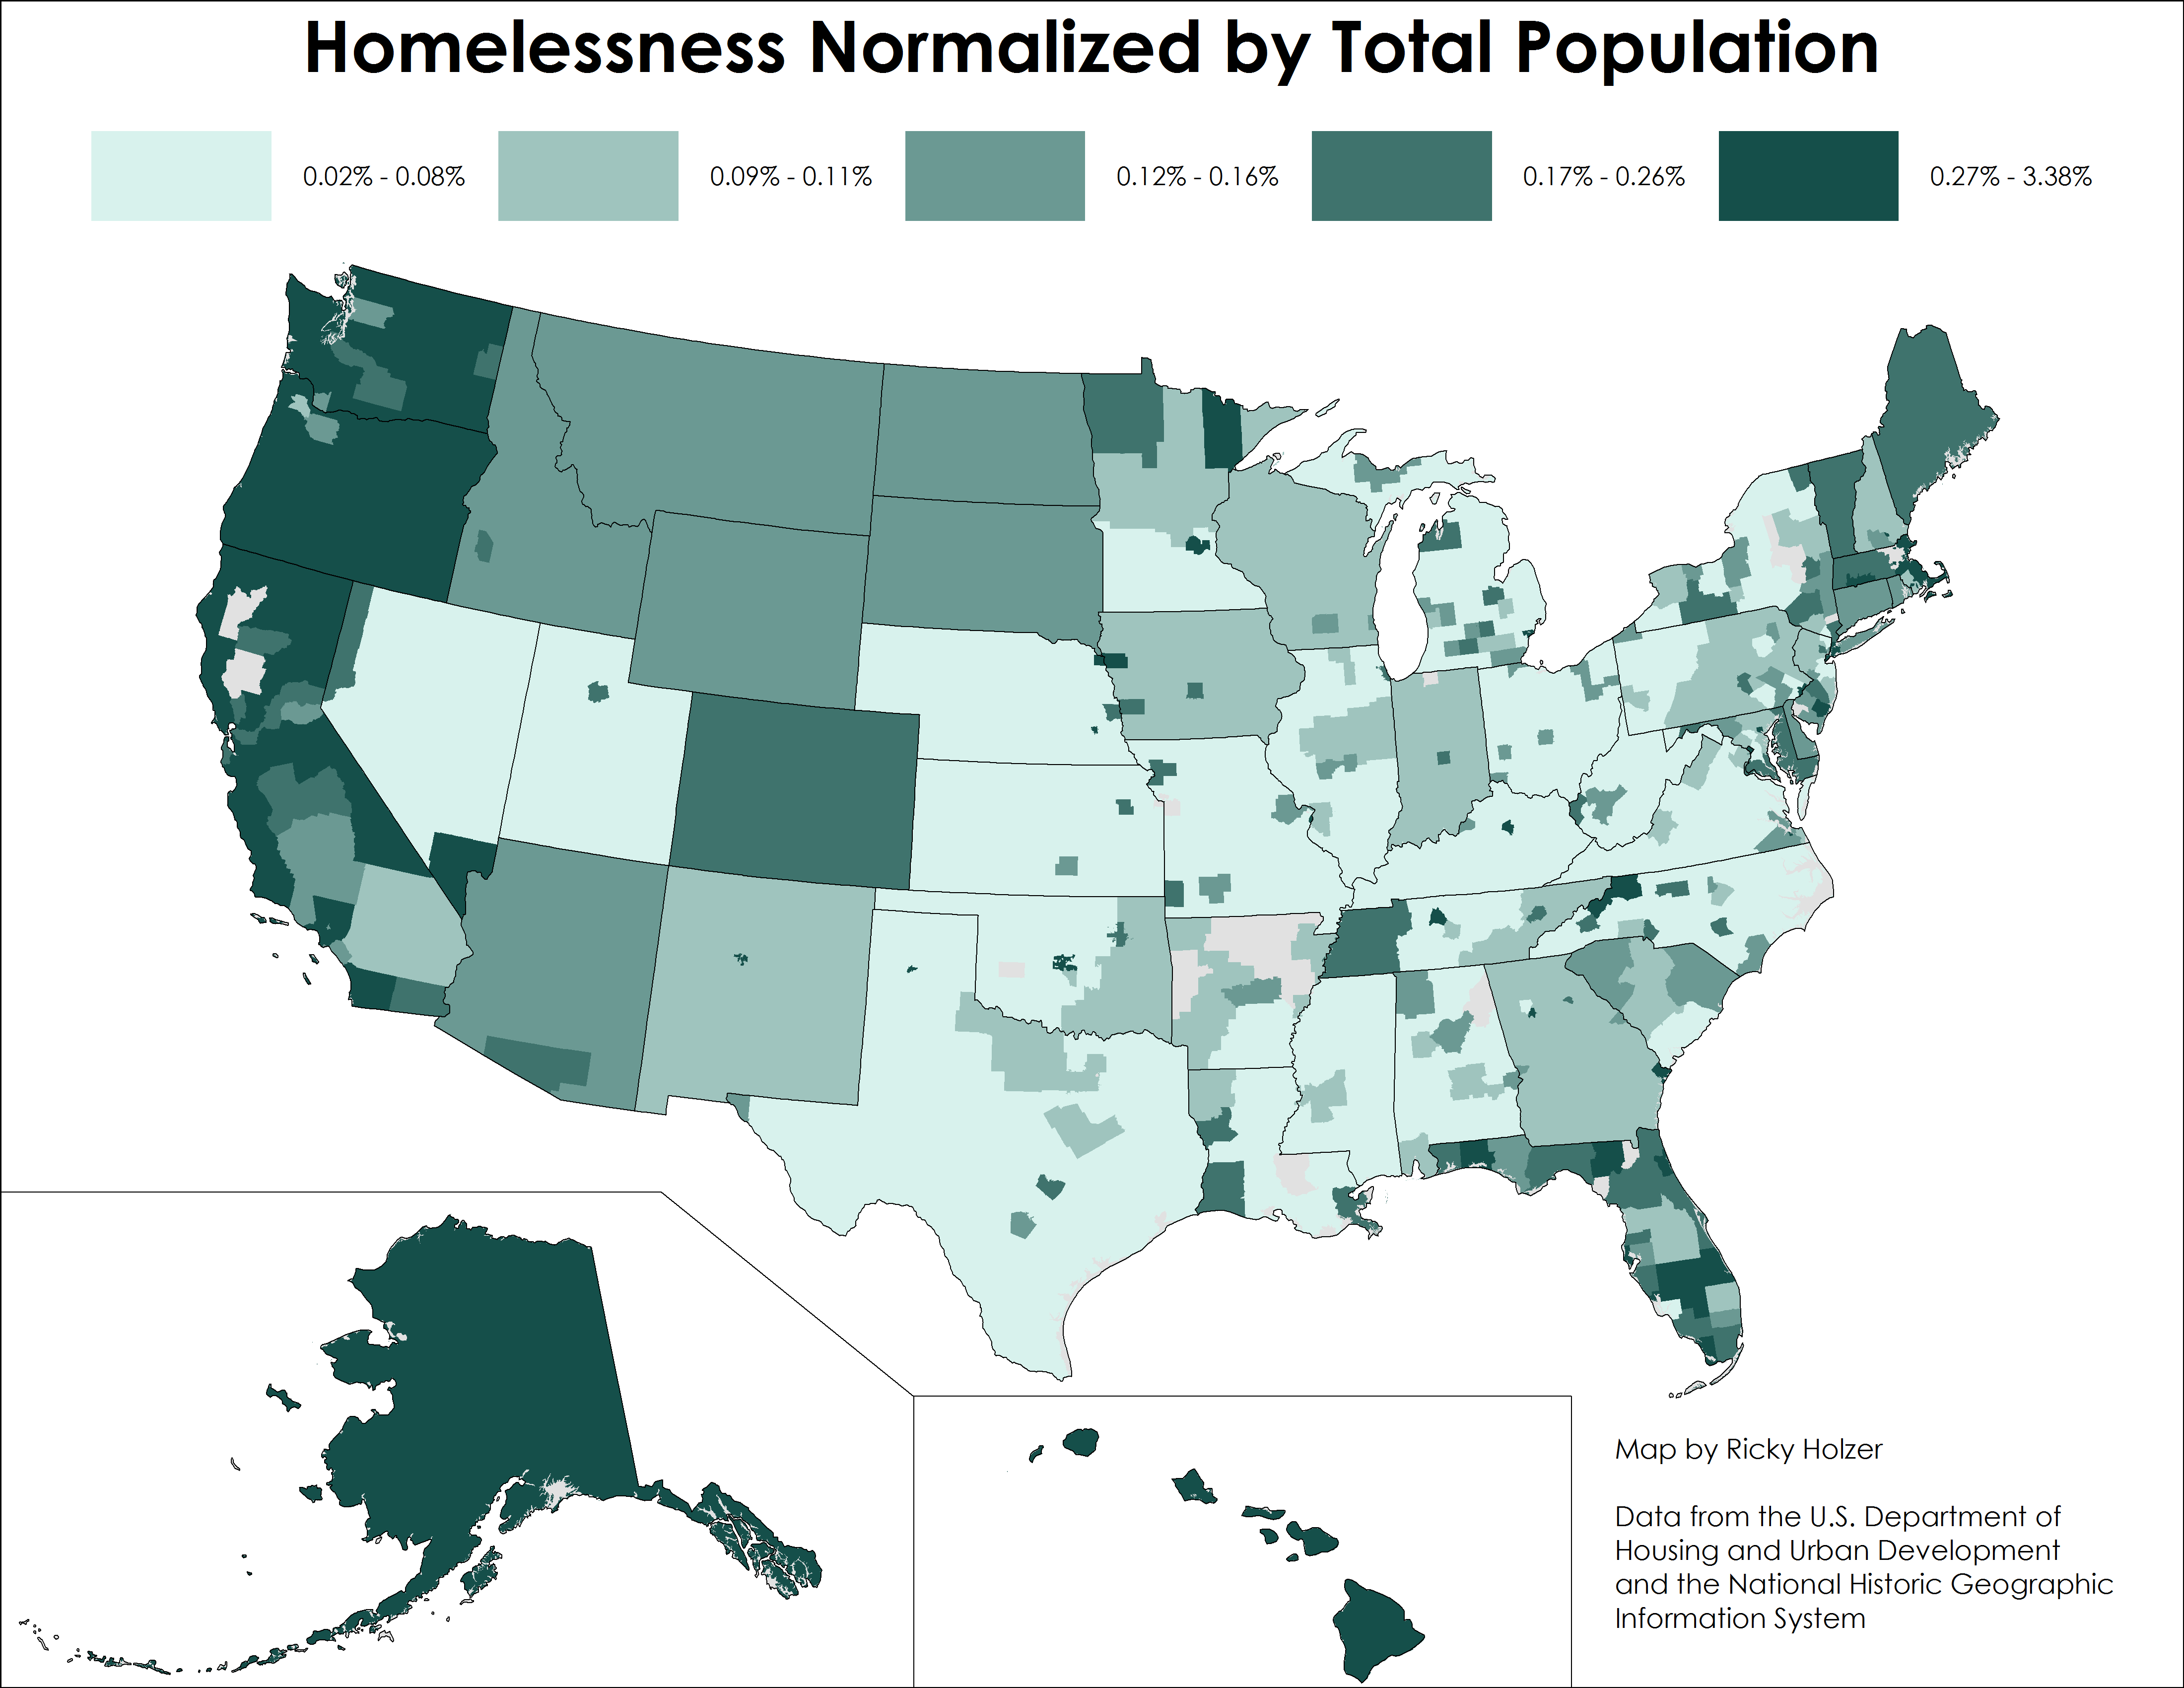
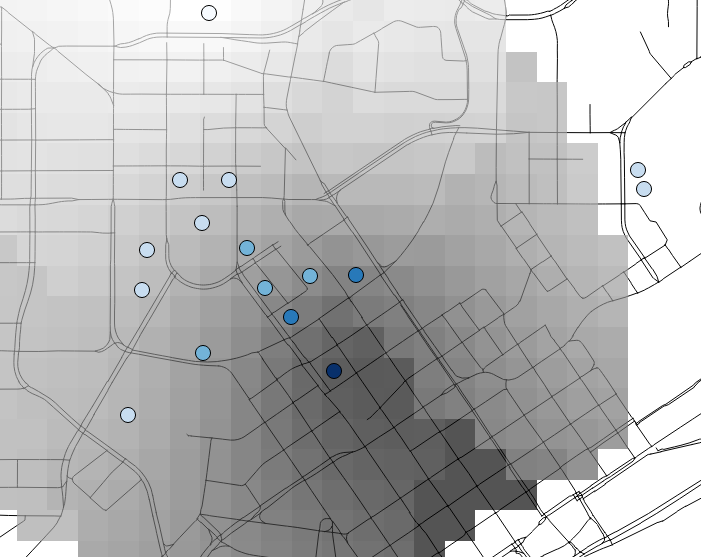
Mapping Homelessness in the United States
After reading an article about homelessness in the U.S., I read the comments at the bottom and saw the typical finger pointing claims that liberal cities like those in California are havens for the homeless because of their lax policies and plush benefits. In particular, Los Angeles is usually called out because of the notorious…
-
How to Translate MySQL Data into GeoJSON Using PHP
I’ve seen a couple StackExchange posts about taking data from a MySQL table and trying to display it on a Leaflet map, but none of the solutions seemed to be fully baked or applicable in my situation. This example comes from my side project, a Midwest hiking website at www.nocoastbestcoast.com, a site I built from…
-
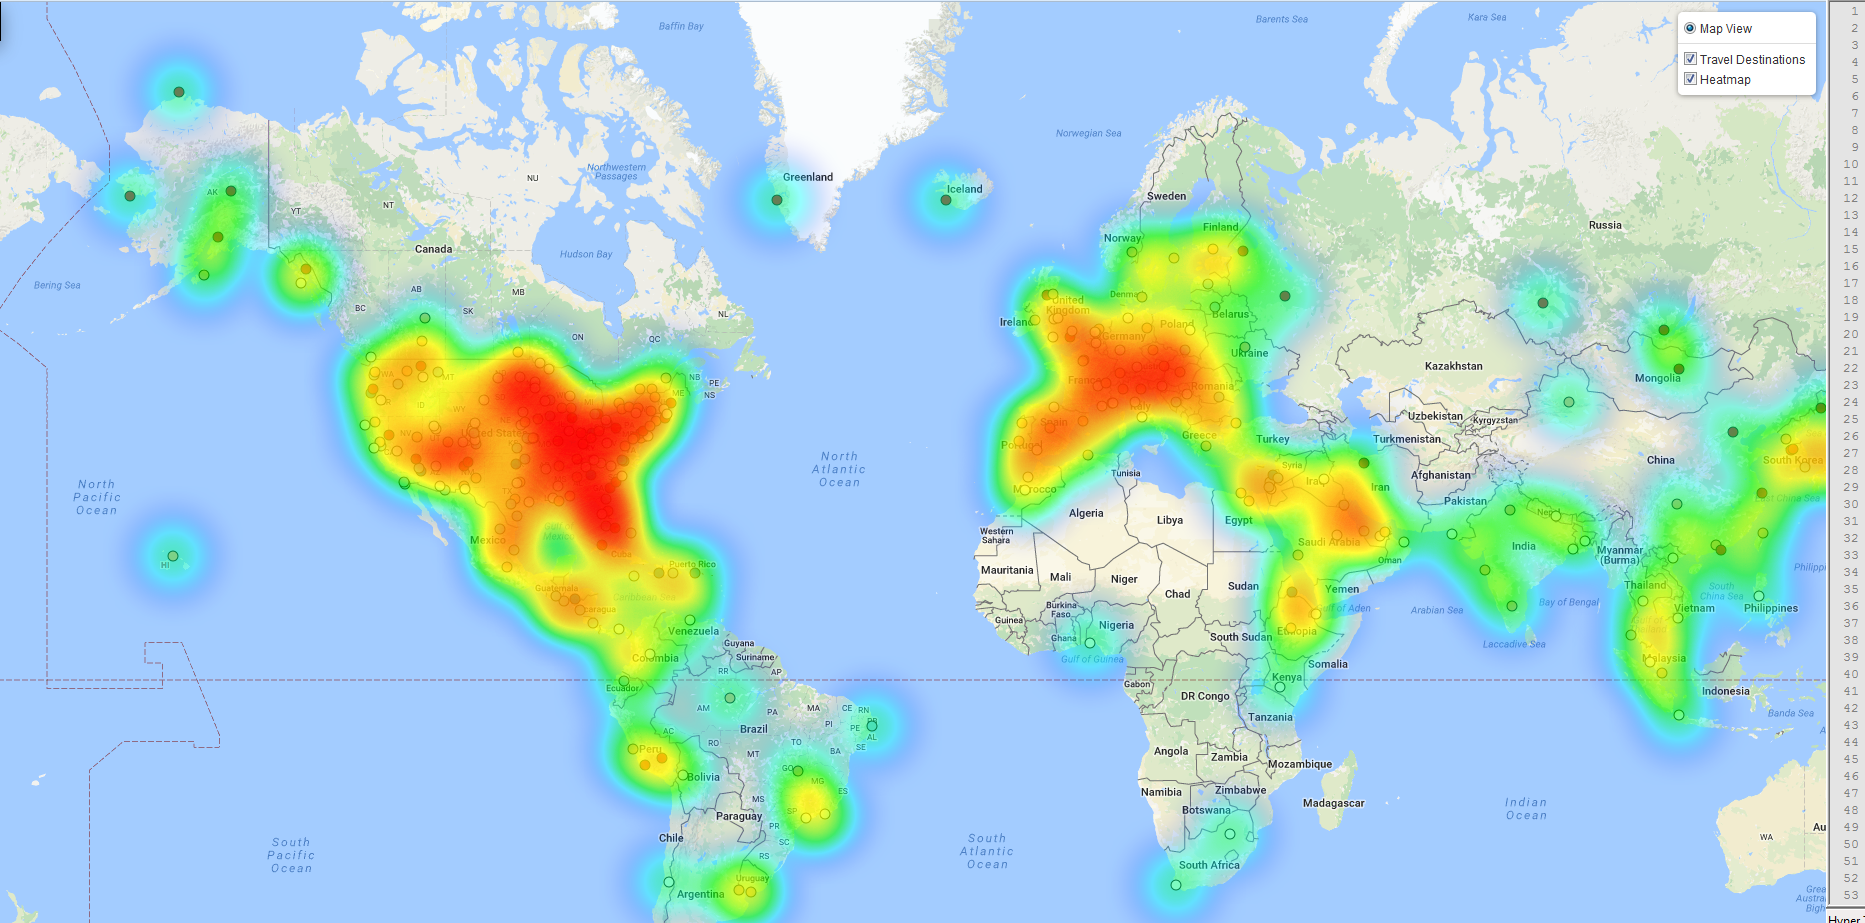
Make a Heatmap of Travel Destinations
I enjoy traveling and I enjoy making maps, so one morning I woke up and decided to combine the two. Steps: I’ve always kept a list in my head of the places I want to go, so this project allowed the data nerd within me to finally create a spreadsheet of that list. A quick…
-
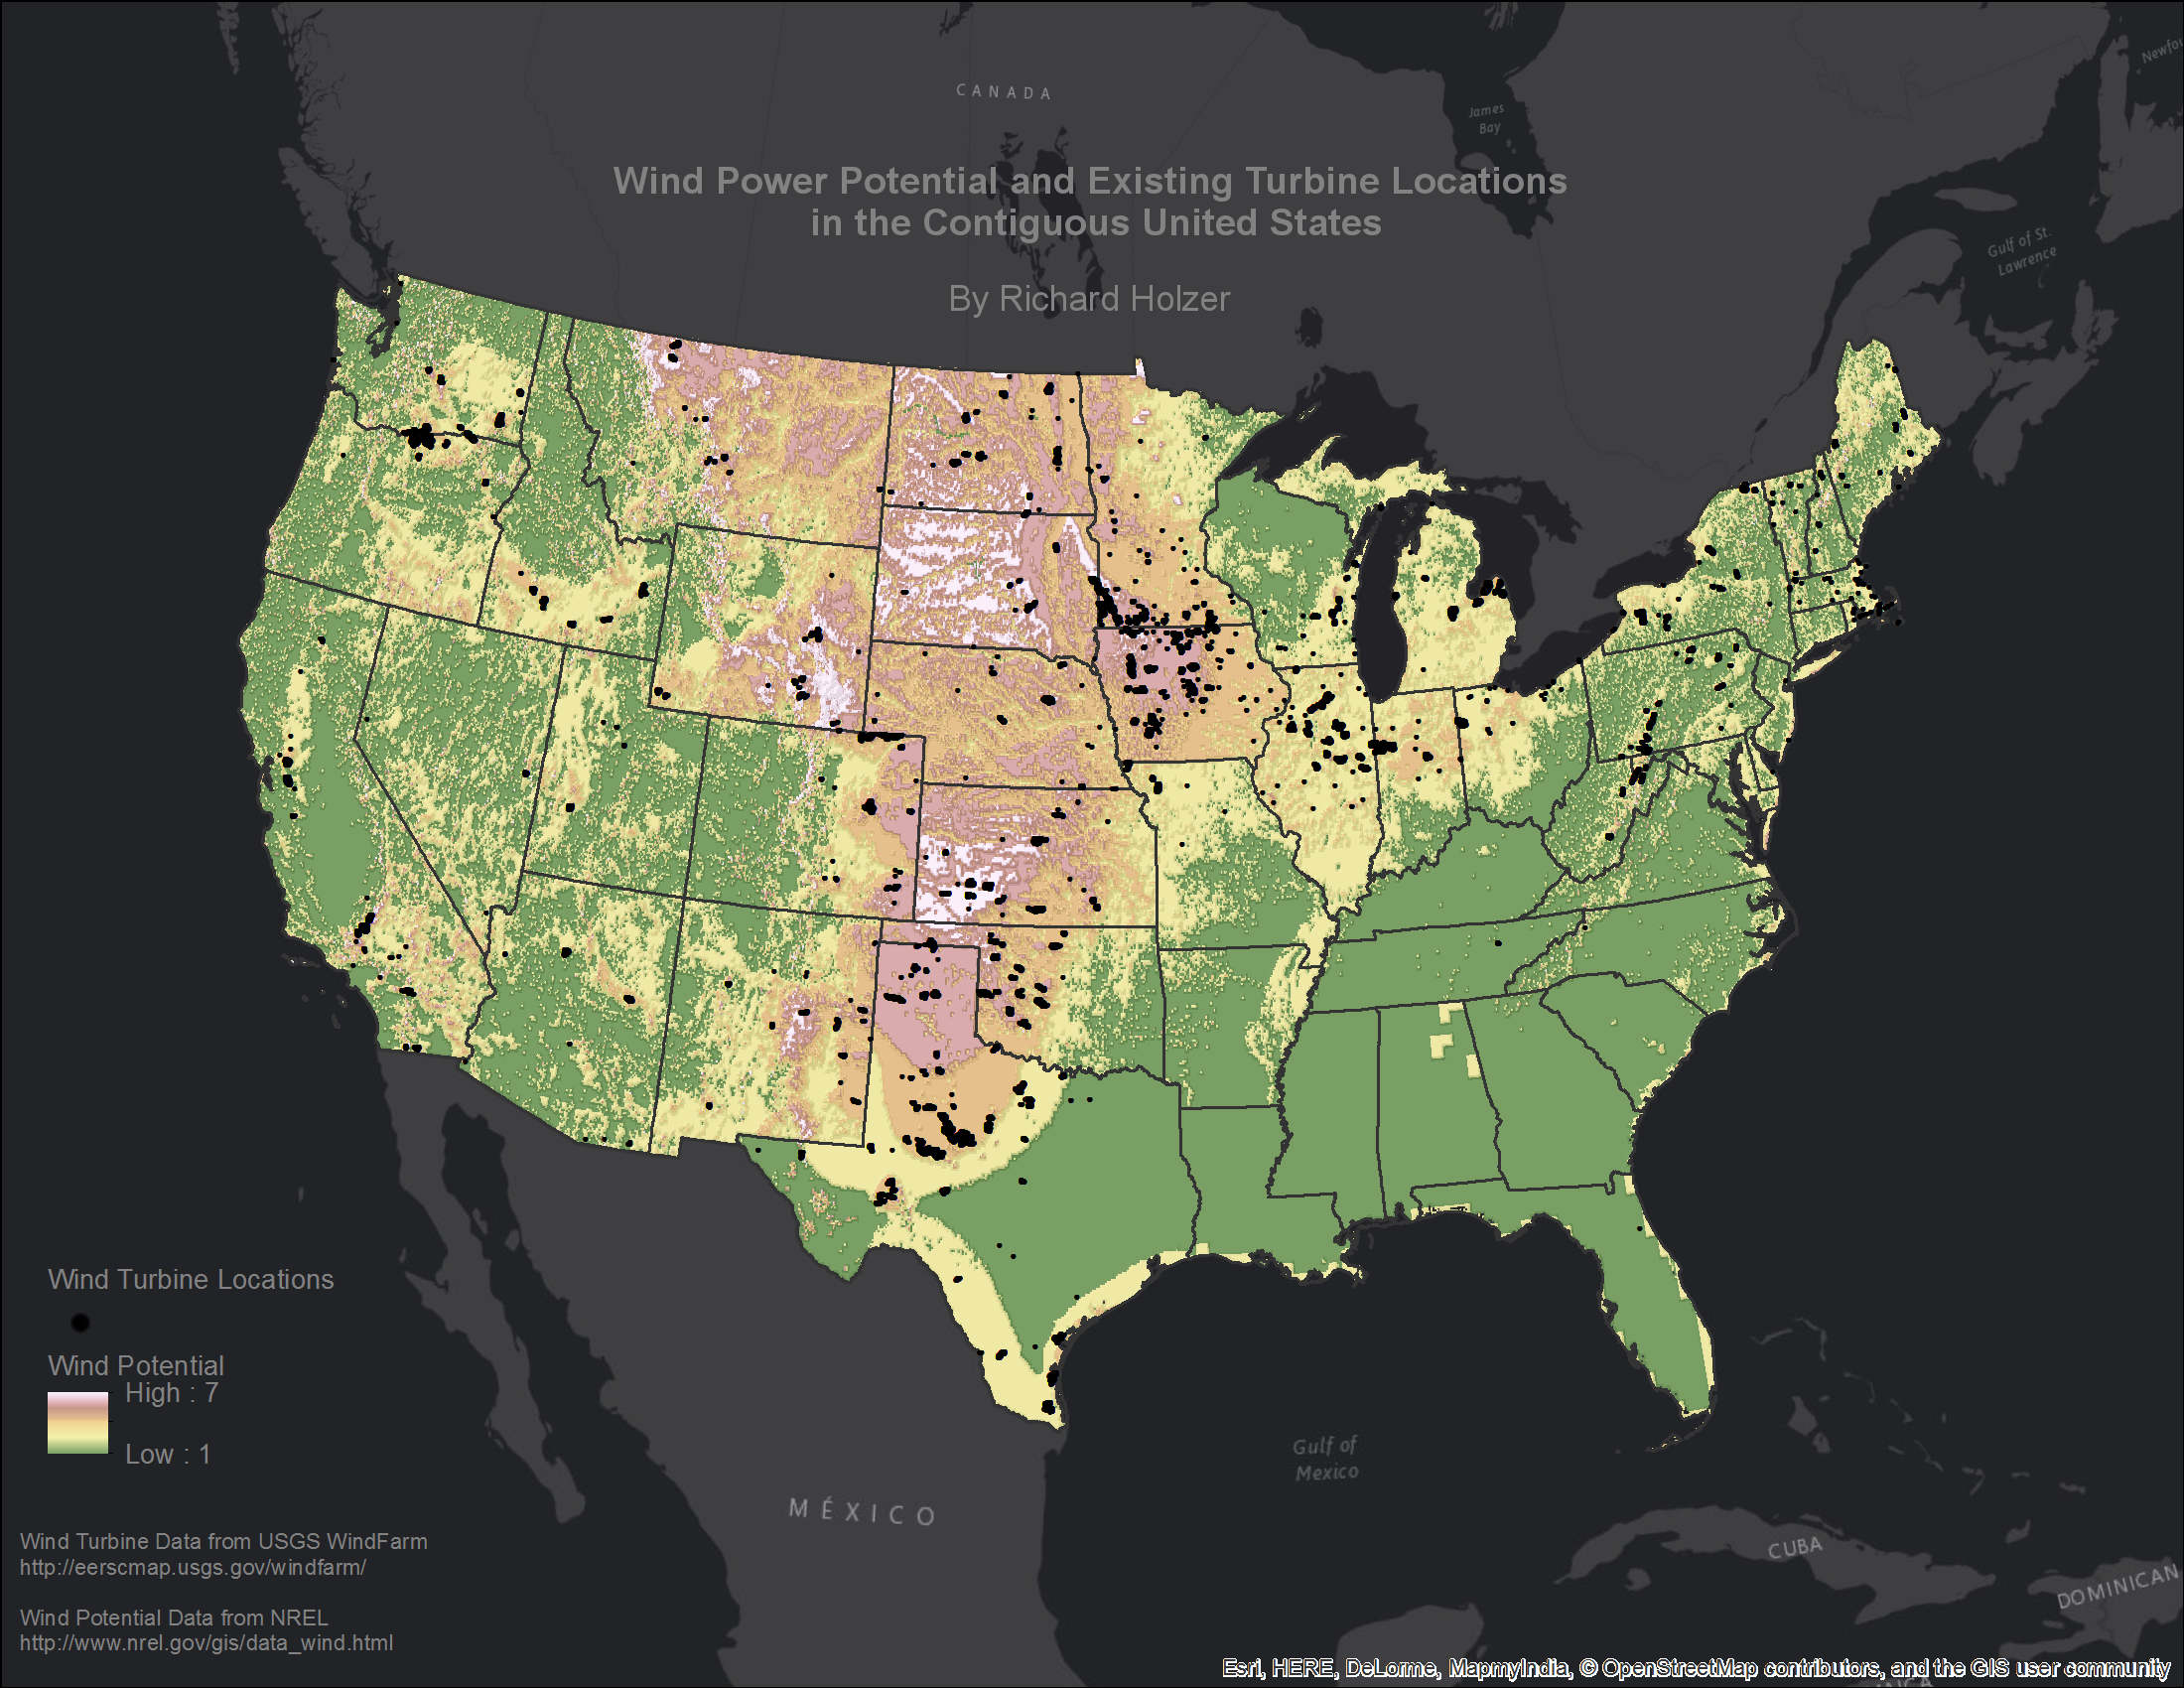
Mapping Wind Power in the US
I remember being amazed looking out the car windows at the wind farms in the Coachella Valley as a child, watching the otherworldly beauty of these giant structures spinning in unity during the day or the UFO-like field of blinking of red lights at night. I have been admiring the work of John Nelson since…
-
Visualizing the growth of the Minneapolis – St. Paul bikeshare program 2010-2015
As the #1 bike friendly city, you won’t be surprised to see the growth of the Nice Ride bikeshare program in Minneapolis. Visualizing the change over time is difficult to do using a static map, so I opted for animation to really show the expanding network and increase in trips. I present to you my…