
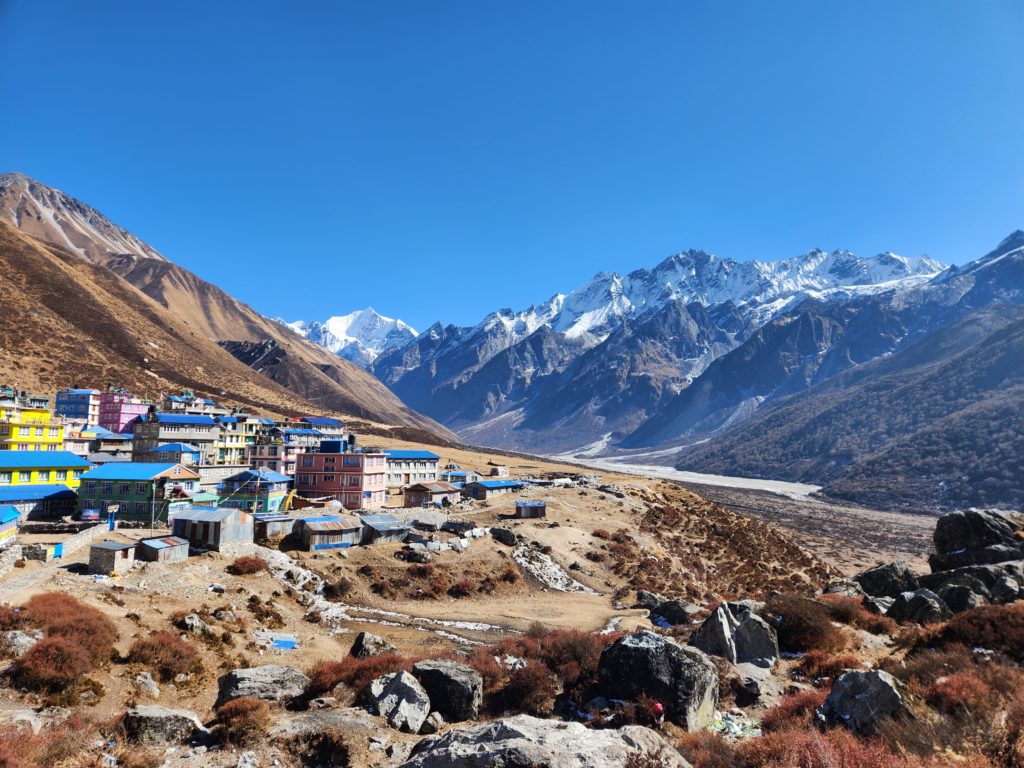
This past January I had the pleasure of visiting Nepal and trekking through the Langtang Valley, a wonderfully scenic place tucked away in a remote corner of the Himalayas. As is now required by law, I hired a guide to navigate the backcountry trails. After a bumpy ride in a packed SUV over some of the most treacherous roads I have ever seen, I was glad I paid someone to accompany me in this unfamiliar land.
Navigation in Nepal is learned the old-fashioned way, through word of mouth and by experience. My own guide spent 4 years as a porter, learning the trekking routes simply by carrying gear up and down the same rocky trails over and over. Anything he didn’t know, like where the closest canteen was that was still open in the January off-season, he could ask a local person. We didn’t use maps at all. Nor did I ever see a map.
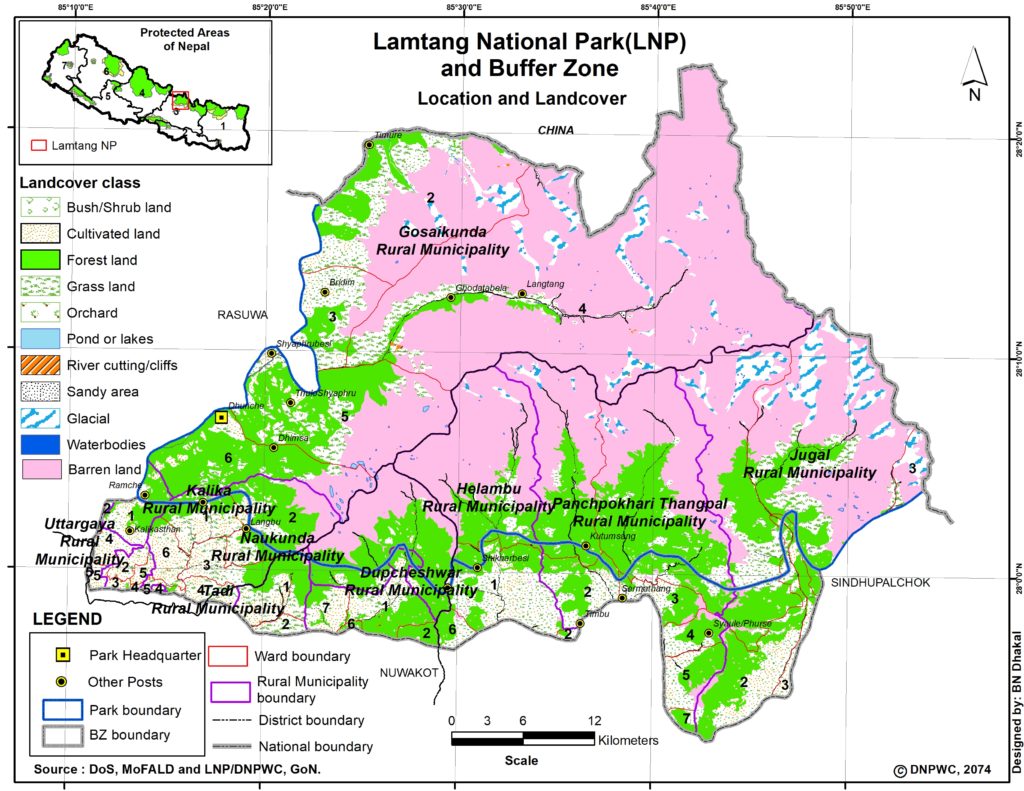
After I arrived back home, I wanted to check a map to see where I had been. AllTrails and Google Maps are both missing any trail information in the Langtang Valley. Mostly, I found rudimentary drawings and pixelated screenshots of Google Maps on trekking company websites. The best official-looking map I could find of the park was the one below, found on the Department of National Parks and Wildlife Conservation’s website. With nowhere else to turn, I decided to create my own map to match the beauty of this place.
Finding Data
When starting the project, the first thing was to determine what specific things need to be on the map. I looked to U.S. National Park maps for inspiration. Here is my list of features taken from those maps:
- Roads
- Trails
- Mountains
- Rivers and lakes
- Place names
- Facility locations
In addition to this list, I added a few more items. Given the immense topography of the Himalayas, elevation data in the form of a DEM and hillshade felt absolutely necessary. Plus, I’ve always wanted to try making a shaded relief map. To further accentuate the dramatic change from forest to scrubland to barren rocky peaks, I found data for land cover and glaciers.
I honestly didn’t expect to find much freely available GIS data for Nepal, but I was pleasantly surprised. You can find links to the data sources I used in a section at the bottom of this post. There were a few missing pieces, however. Labeling facility locations to the degree of detail of a U.S. National Park map would have been a futile exercise, since information is not easily available nor accurate. So, I omitted those and created my own layers for the rest.
Making Up Data
Place Names
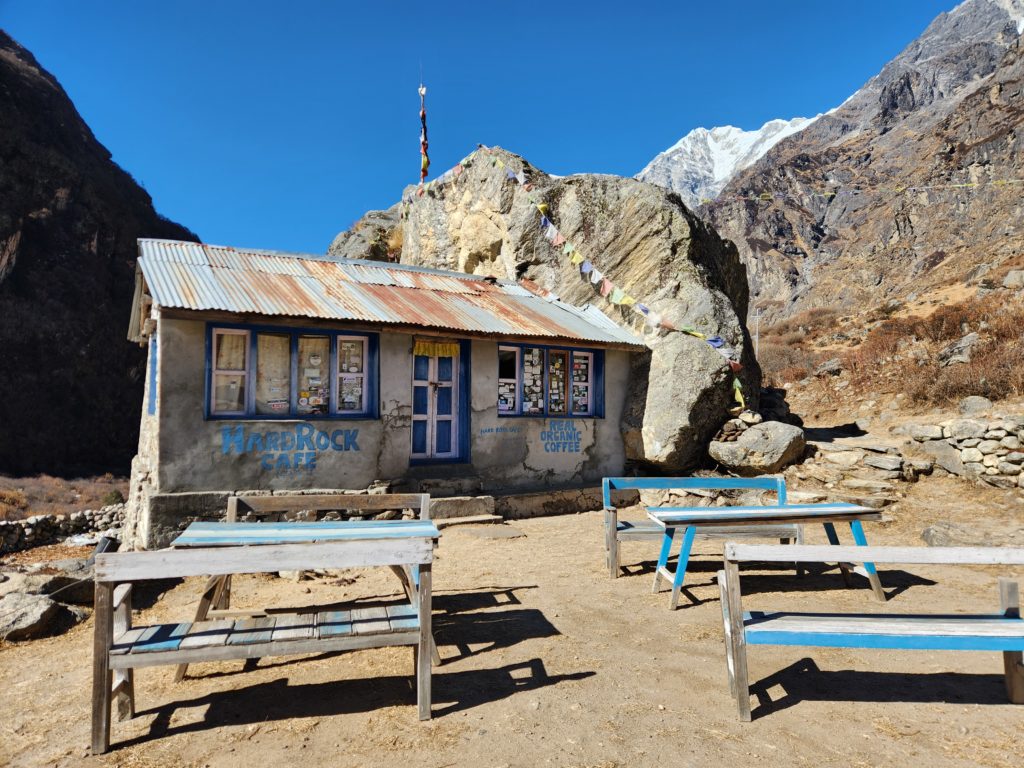
Place names were devilishly difficult to locate, for several reasons. One glaring issue is that no one has officially mapped many of these places, so I couldn’t just download data from OpenStreetMaps and call it good. Another issue is that “significant” places along the trek were often nothing more than a single teahouse or restaurant (and when I say restaurant, I mean a shack with a couple of homemade picnic tables outside).
The final issue is something I noticed while on the trip: romanized versions of Nepali words never seem to have a consistent spelling. For example, the peak Tsergu Ri was the final destination for my trek, and various hand-painted signs along the way would spell it anywhere from “Tsergo Ri” to “Chegory”.
Because of this inconsistency, I thought it would be important to have the Nepalese script for all of the place names. However, I have all but forgotten the few simple Nepalese phrases my guide taught me, so I had to make due with a Devanagari script converter and Google Translate when I couldn’t find the official Nepalese words. Let me apologize now for the numerous spelling mistakes on my map.
Mountain Peaks
Much like place names, the names of mountain peaks were often inconsistent. I could have downloaded this data elsewhere, but since there were only a dozen or so important mountains in the park, I figured it would be easier to make the data myself.
Trekking Routes
Once I had place names, figuring out the trekking routes was a matter of connecting the dots based on itineraries I found on trekking company websites. Armed with data for the road and trail network, I traced the most sensible routes between places and filling in gaps intelligently. The large scale of the map meant that details were not important, and no one would get mad if I skipped a few switchbacks.
Assembling the Map
This was the most time-consuming part of the whole process. Though I had a general idea of what the final map should look like, it took hours and hours of trial and error to hone the styles and labels for everything. One particular design theme I tried to integrate was the usage of the five colors of Tibetan prayer flags found at every sacred place along the trek: blue, white, red, green, and yellow, traditionally symbolizing sky, wind, fire, water, and earth respectively.
By the end of the experience, I realize now why many professional cartographers export their map into graphic design software ASAP. As for me, I loaded my finished image into PowerPoint to add the title, legend, and overlay map image instead of hitting my head against the wall trying to use QGIS’s layout function.
Finished Product

Sources
Park Boundaries
http://geoportal.ntnc.org.np/layers/ntnc:Langtang_National_Park/#/
Land Cover
https://esri.maps.arcgis.com/apps/instant/media/index.html?appid=fc92d38533d440078f17678ebc20e8e2
DEM
Water
https://data.humdata.org/dataset/nepal-watercourses-rivers
Glaciers
https://nsidc.org/data/nsidc-0770/versions/1
Roads and Trails