
I enjoy traveling and I enjoy making maps, so one morning I woke up and decided to combine the two.
Steps:
- Create list of destinations, coordinates, and priority rating
- Convert to GeoJSON
- Add to Leaflet map
- Use Leaflet.Heat to create heatmap
I’ve always kept a list in my head of the places I want to go, so this project allowed the data nerd within me to finally create a spreadsheet of that list. A quick search online for something like “world cities latitude longitude” will find you several pre-made lists of cities, so you won’t have to look up the coordinates for every one on your list.
Having a list of cities is nice, but it doesn’t help me decide which one I need to go to next, so I added a priority rating on a 1 to 5 scale — it works best later if 5 is where you want to go most (I did it the opposite way and had to do some funny calculations to fix it since I was too lazy to retype every rating).
Next I used QGIS — my preferred method — to convert my CSV to GeoJSON. All you have to do is add a delimited text file and select the X and Y fields, and then once it\’s added, you just right click the feature, click “Save As…” and save it as a GeoJSON. Make sure you select EPSG: 4326 (WGS 84) as your coordinate system when saving your GeoJSON. There are other methods for converting, but I like using QGIS so I can play around with the data first and make sure it is correct and functions as planned.
One last bit of prep before adding your GeoJSON to a Leaflet map, change the file extension from .geojson to .js, and then open the file in a text editor and add “var destinations =” in front of all of the text. It will look like this:
var destinations = {GEOJSON CONTENTS ARE HERE}
Now we’re ready to map! Prepare your HTML document for a Leaflet map (if you don’t know how, check out the Leaflet Quick Start Guide).
First I added a basic color picker function using a switch statement to return a marker color based on the priority rating:
// Color picker function

function getColor(x) {
    var z;
    switch (x){
    case 1:
        z = "#ca0020";
        break;
    case 2:
        z = "#f4a582";
        break;
    case 3:
        z = "#f7f7f7";
        break;
    case 4:
        z = "#92c5de";
        break;
    case 5:
        z = "#0571b0";
        break;
    default:
        z = "#000"
    };
    return z;
};
Instead of specifying colors for each value in a switch statement, more advanced users could use Chroma.js to create a color scale:
// Alternative color picker function using Chroma.js

function getColor(x) {
    var scale = chroma.scale(['blue', 'white', 'red']).domain([1,5]);
    return scale(x).hex();
};
Once we have a color picker function, we can define the marker style:
// Marker style function

function geojsonMarkerOptions(feature){
    return {
    radius: 5,
    fillColor: getColor(feature.properties.priority),
    color: "#000",
    weight: 1,
    opacity: 1,
    fillOpacity: 1
    };
};
Now we’re ready to add the GeoJSON as a circlemarker feature using our defined style. The function also pushes the coordinates of each point and the priority rating to an array that we will use to make the heatmap later.
// Variable for coordinates array for heatmap
var coords = [];

// Add GeoJSON using circlemarkers
var dest_geojson = L.geoJson(destinations, {
    pointToLayer: function (feature, latlng) {
        return L.circleMarker(latlng, geojsonMarkerOptions(feature));
    },
    onEachFeature: function (feature, layer) {
    //Push the coordinates and priority rating to the array
    coords.push([feature.geometry.coordinates[1], feature.geometry.coordinates[0], feature.properties.intensity]);
    }
}).addTo(map)
Using Leaflet.Heat is surprisingly simple. First, we define the options (I had to play around with the radius, gradient, and blur until the map looked right):
// Heatmap options

var opts = {
    minOpacity: 0.5,
    radius: 40,
    gradient: {0: 'blue', 0.4: 'cyan', 0.6: '#0f0', 0.76: 'yellow', 0.85: 'orange', 0.95: 'red', 1: 'brown'},
    blur: 30,
    maxZoom: 8
};
Then, we call the function using the coordinate array we created earlier and add the layer to the map:
// Add heatmap to map

var heat = L.heatLayer(coords, opts).addTo(map);
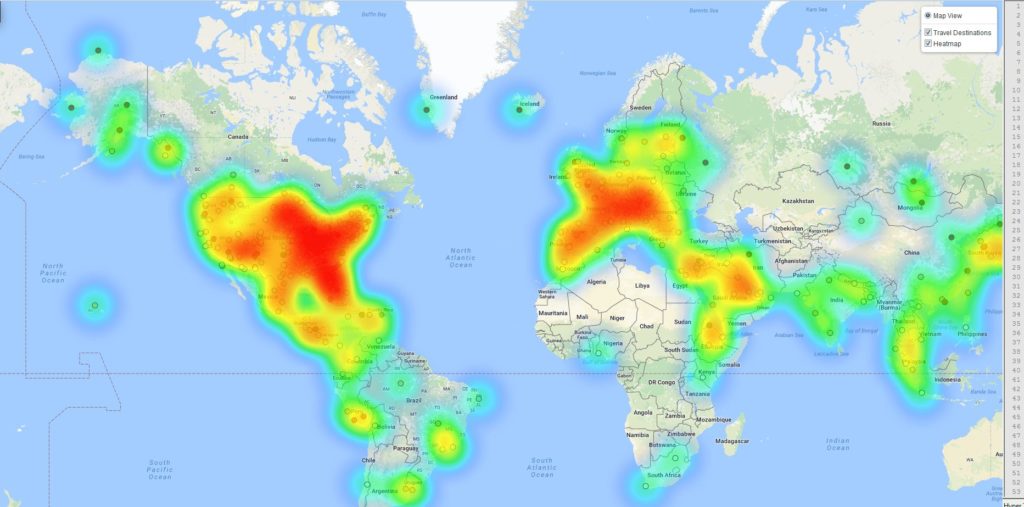
And there you have it, your end result should look something like mine below. The full code is included on the bottom of the post for your convenience. Happy mapping!
// Google basemap

var googleStreets = L.tileLayer(‘http://{s}.google.com/vt/lyrs=m&x={x}&y={y}&z={z}’,{
    maxZoom: 20,
    subdomains:[‘mt0’,’mt1’,’mt2’,’mt3’],
    attribution: ‘Map Data © 2016 Google’
});

var map = L.map(‘map’,{
    center: [33.9563,-36.0267],
    zoom: 3,
    zoomControl: false,
    layers: [googleStreets]
});

// Color picker function

function getColor(x) {
    var z;
    switch (x){
    case 1:
        z = “#ca0020”;
        break;
    case 2:
        z = “#f4a582”;
        break;
    case 3:
        z = “#f7f7f7”;
        break;
    case 4:
        z = “#92c5de”;
        break;
    case 5:
        z = “#0571b0”;
        break;
    default:
        z = “#000”
    };
    return z;
    }

// Marker style function

function geojsonMarkerOptions(feature){
    return {
    radius: 5,
    fillColor: getColor(feature.properties.priority),
    color: “#000”,
    weight: 1,
    opacity: 1,
    fillOpacity: 1
    };
};

// circlemarker for destinations
var coords = [];

var dest = L.geoJson(destinations, {
    pointToLayer: function (feature, latlng) {
        return L.circleMarker(latlng, geojsonMarkerOptions(feature));
    },
    onEachFeature: function (feature, layer) {
    layer.bindPopup(“<strong>“ + feature.properties.city_ascii + “, “ + feature.properties.country +”</strong><br>Urgency Rating: “ + feature.properties.intensity * 100 + “%”);
    coords.push([feature.geometry.coordinates[1], feature.geometry.coordinates[0], feature.properties.intensity]);
    }
}).addTo(map);

//heatmap of points

var opts = {
    minOpacity: 0.5,
    radius: 40,
    gradient: {0: ‘blue’, 0.4: ‘cyan’, 0.6: ‘#0f0’, 0.76: ‘yellow’, 0.85: ‘orange’, 0.95: ‘red’, 1: ‘brown’},
    blur: 30,
    maxZoom: 8

};

var heat = L.heatLayer(coords, opts).addTo(map);

// Layer control

var basemap = {
    ”Map View”: googleStreets,
};
var overlay = {
    ”Travel Destinations”: dest,
    ”Heatmap”: heat
};

L.control.layers(basemap, overlay, {collapsed: false, position: ‘topright’}).addTo(map);