I remember being amazed looking out the car windows at the wind farms in the Coachella Valley as a child, watching the otherworldly beauty of these giant structures spinning in unity during the day or the UFO-like field of blinking of red lights at night.
I have been admiring the work of John Nelson since listening to his talk on cartography at the Esri User Conference last year, so I found a good project to emulate a few of his techniques.
Data for the location of wind turbines comes from the USGS. You can pan and zoom on their map and download data here. The National Renewable Energy Laboratory (NREL) provides data about wind power potential that you can download here — I used the “United States Wind Power Class” data in raster format, but vector data for each individual state are available.
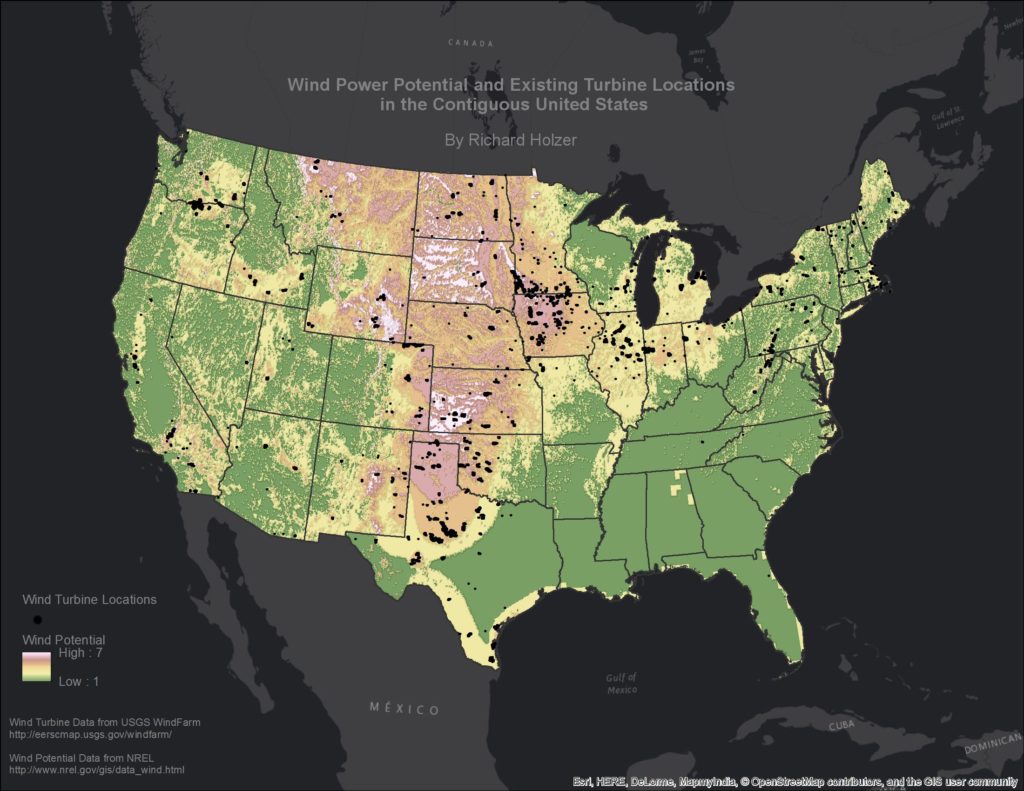
Upon opening the wind power potential data, it immediately reminded me of topographic maps, so I used a green to red to white color gradient. However, the map still felt a little flat, so I created a hillshade raster using the wind power potential data and added that layer below. I added the wind turbines layer on top of that and used a tiny, black symbol that would effectively show where there is wind turbine clustering. In classic John Nelson style, I overlaid everything on the Esri dark grey canvas basemap.
The final product is below. As you probably expected, wind farms tend to cluster where it is windy. However, this map also highlights the untapped potential in the Great Plains, notably in Nebraska and South Dakota. I’m not entirely in love with the symbology for wind turbines, since it does not display the true density well — the black blobs don’t really visualize whether an area has 5 or 100 turbines, just that there are some unknown number close by. Further experimentation proved that it is difficult to symbolize such small entities at the nationwide scale, so perhaps some sort of raster would better portray the results.