I was looking for map inspiration when I stumbled across an atlas of projects on Daniel Huffman’s blog, somethingaboutmaps. His map of his contacts by area code seemed like a fun and easy exercise to repeat.
Data Acquisition
The hardest part of this map (like most GIS projects) was finding and preparing the necessary data. Surprisingly, there doesn’t seem to be an authoritative government site with the geographic boundaries for area codes in the U.S. The best source I found was an ArcGIS layer package. If you’re using ArcGIS, then obviously this works great.
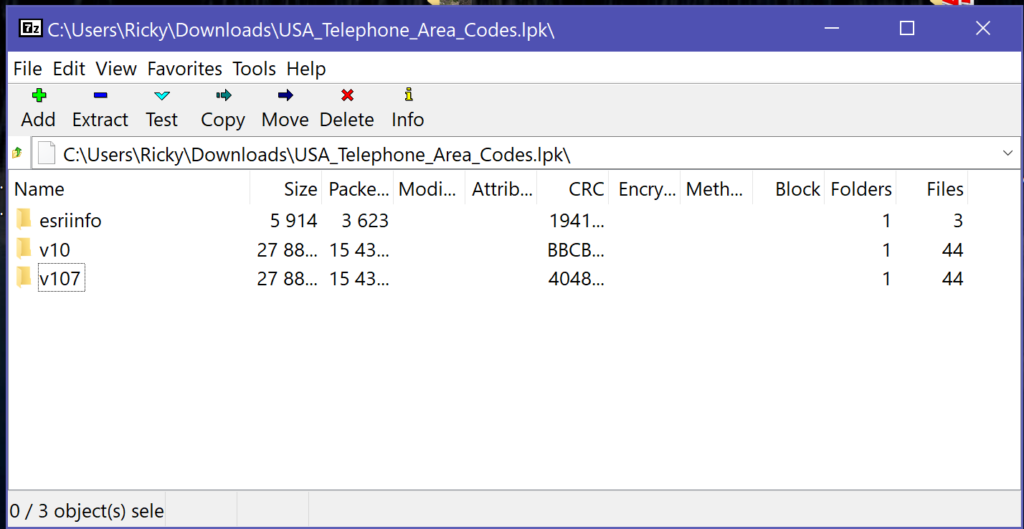
But if you’re too cheap for fancy software like I am, then you need to use a free utility like 7zip to open the .lpk file as pictured below. From there, you can extract the geodatabase before opening it in something free like QGIS. To save you some effort, I have shared the area code boundaries in GeoJSON and KML format at the end of this post.
Now that we have our area code boundaries, we need to export contacts data to shade the map. If you use an Android phone and backup your contacts to your Google account, this task is straightforward. Just head to contacts.google.com and hit the export button on the upper right corner of the list of contacts (next to the print button). Select export as Google CSV, and it will start downloading.
If you use an iPhone, this task is a bit more difficult. You will have to login to your iCloud account, select all of your contacts, and export as a vCard. Once you download the file, you need to convert it to spreadsheet format by googling to find a free conversion tool.
Data Preparation and Processing
Whichever method you choose, now you must open the spreadsheet in Excel and navigate to the column with phone numbers. Copy and paste this column into an empty sheet to make it easier to work with.
You’ve probably noticed that the format for each phone number varies wildly, with some numbers containing the country code, some with parenthesis around the area code and others without, hyphens between number groups, etc. Clean up the formatting by hitting Ctrl + F to open Find and Replace and using the replace function to change any symbols like ( ) – + with nothing. If you have any contacts with international numbers (and hence no U.S. area codes), manually remove those.
With the data cleaned up, you can begin extracting the area codes using the formula below.
=IF(LEFT(A1,1)="1", MID(A1,2,3), LEFT(A1,3))To explain this formula: Because no area codes begin with the digit 1, we can assume that all numbers starting with 1 have the U.S. country code. Thus, the if statement identifies phone numbers that begin with 1 and extracts the 3 digits after that 1. If a phone number doesn’t start with one, it simply extracts the first 3 digits.
Apply the formula to every cell with a phone number, and the results will yield a column of area codes. Use a pivot table with area code as the row and count of phone number (as shown below) to calculate the frequency of each area code in your contacts.

Copy and paste the values from the pivot table into a new sheet, and then save that sheet as a CSV. Now you’re ready to make a map!
Open your GIS software of choice, and add the area code boundaries and the CSV you just created to the map. Join the CSV to the boundaries by matching the area code fields. If the GIS gods are smiling upon you, both files will have the area codes with a field type of string. If not, you’ll have to do some field conversions to make sure the field types match. After joining, check to ensure that the count of area codes from your CSV has a numeric field type or you won’t be able to color your map.
Making a Map
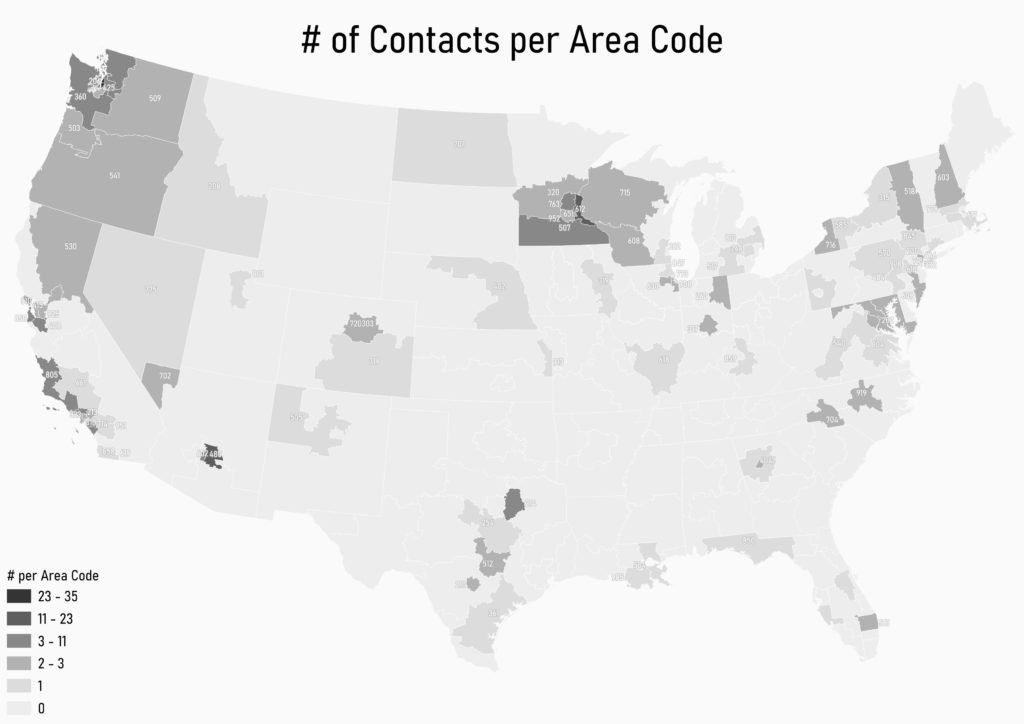
Once the data is joined, you can symbolize the area codes layer based on the count of area codes. Build a map layout with a nice legend and title, and your final product will look something like mine below.