
After reading an article about homelessness in the U.S., I read the comments at the bottom and saw the typical finger pointing claims that liberal cities like those in California are havens for the homeless because of their lax policies and plush benefits. In particular, Los Angeles is usually called out because of the notorious Skid Row and a homeless population larger than most small towns and suburbs. As a former Angelino, this is personal, and I want to prove that my city that people view as a mountain of garbage is in fact just a full wastebasket. Besides, South Park has me convinced that everyone ships their homelessness problem to LA:
The main problem with most articles is that when presenting statistics for homelessness, the authors do not normalize by population, so places like Los Angeles and New York are at the top of the list without accounting for the fact that these are the two largest cities in the country and as such would be expected to have more people experiencing homelessness. Thus I will make maps and normalize the data by area and by population to determine the magnitude of the problem in different places across the country.
Vocabulary
Here are some terms you should know before continuing reading this article:
U.S. Department of Housing and Urban Development (HUD) – the federal agency responsible for all housing related funding, including homelessness programs and affordable housing.
Continuum of Care (CoC) – HUD’s program funding all activities related to homelessness that replaced multiple past programs and aims to use a community level approach to solve homelessness. In this article it mostly refers to a geographic boundary at which level the community can apply for and receive funds. I’m not entirely sure how they chose where to create CoCs or how to draw the boundaries, but I can assume it was a highly political process given that there are individual CoCs for certain cities contained within a larger county CoC, such as the Pasadena CoC, Glendale CoC, and Long Beach CoC all geographically within the Los Angeles City and County CoC. In summation, CoC is both a source of funding and a geographic boundary, clear as mud.
People Experiencing Homelessness – the correct way to refer to someone without permanent shelter as stated by the U.S. Interagency Council on Homelessness. This “people-first” phrase intends to describe homelessness as a problem someone can fix rather than defining the person by their lack of shelter as in “homeless person”. I try to use this phrase as much as possible in this article, but I’m a person experiencing laziness and my editing skills could use some work.
Data and Process
HUD graciously provides the data for Point-in-Time homeless counts, a spreadsheet containing counts from 2007-2017 taken on a night in January in each Continuum of Care (CoC). If you wish to do your own analysis of one or a couple states, you can find a nicely packaged set with GIS files for CoC boundaries and Census demographic data at the block group level in a zipped folder for each state.
For national level analysis, it’s easiest to download the national CoC boundary file for the year of interest at the previously listed link and Census data from the National Historic Geographic Information System (NHGIS); you will need to create a free account and properly cite the source wherever you use it (like I did in the references section at the bottom of the page). On a side note, the NHGIS site is so much simpler to use than the American Factfinder, and the creators of the data had the foresight to include a GISJoin field on both the data tables and GIS files to save the hassle normally associated with joining Census data to TIGER/line files.
The process is rather simple after collecting the data. Add your layers and join your tables in your favorite GIS software, then perform a spatial join that joins the demographics from the block groups layer to the CoC boundaries layer. Create and calculate new fields for area in square miles, homeless population divided by total population, and homeless population divided by area in square miles, and finally create maps for each.
Looking at the Numbers
According to the data, there were approximately 549,928 people experiencing homelessness in the U.S. in 2016, including both sheltered and unsheltered people. It is important to note that this is only an estimate, since counting people experiencing homelessness accurately is inherently difficult given their transient nature and tendency to sleep in hidden places away from others who may bother them. Put within the national context of a population of 318,558,162 in 2016, less than 0.2% of the total population was experiencing homelessness, so you might think “Great job America, only a fraction of a percent of the population doesn’t have shelter!” However, when you put this number to scale, the total number of people experiencing homelessness in the U.S. is slightly lower than the entire population of Albuquerque (559,277 in 2016). Going further, 176,357 of that total were unsheltered, a number comparable to the entire population of Providence, RI (179,219 in 2016) — the problem seems a little worse now that you imagine a Skid Row the size of a city! In fact, these numbers increased in 2017, with 553,742 total and 192,875 unsheltered people experiencing homelessness nationwide.
Another point to consider is that not all people experiencing homelessness are the stereotypical unkempt dude with a beard asking for your change on a street corner. In actuality 194,716 of those in the U.S. are families, accounting for over one third of all people experiencing homelessness, a number larger than the entire population of Salt Lake City (193,744 in 2016). In addition, 39,471 or 7% are veterans, and 86,132 or 16% are considered chronically homeless – defined by HUD as someone with a disability living without permanent shelter for one year straight or for a total of one year in a period of three years.
We can’t force everyone to move out of Albuquerque in order to house all the people experiencing homelessness there instead, though Albuquerque has one of the most progressive programs to help the homeless. Thus, this is and will always be a problem scattered across cities and towns. Knowing where this problem occurs can help explain why it occurs so we may find solutions to address the root causes. Without further ado, I present to you the first map in the series, displaying the total number of people experiencing homeless within each CoC in 2016:

Based on this map, the places with the least people experiencing homelessness are the desolate high desert of Nevada, frozen tundra of Minnesota and Upstate New York, and agricultural areas in Oklahoma, Texas, Tennessee, Arkansas, and Illinois. The places with the most people experiencing homelessness are areas along the west coast, the Rust Belt, populated areas in the Northeast, and populous states in the South – Texas, Florida, Georgia, and North Carolina. Strangely enough, it seems that the cornfields of Iowa and the dairy farms of Wisconsin are also hotbeds of homelessness (though in reality those are some of the coldest beds someone forced to sleep outside could have – remember these counts were done in January). Listing the top and bottom 10 CoCs reveals the results below:
Places with the highest number of people experiencing homelessness
- New York City CoC – 73,523
- Los Angeles City and County CoC – 43,854
- Seattle/King County CoC – 10,730
- San Diego City and County CoC – 8,669
- District of Columbia CoC – 8,350
- San Francisco CoC – 6,996
- San Jose/Santa Clara City and County CoC – 6,524
- Boston CoC – 6,240
- Las Vegas/Clark County CoC – 6,208
- Philadelphia CoC – 6,112
Places with the lowest number of people experiencing homelessness
- Garrett County, MD CoC – 20
- Jamestown/Dunkirk/Chautauqua County, NY CoC – 23
- Boone, Baxter, Marion, Newton Counties, AR CoC – 27
- Cattaragus County, NY CoC – 27
- Franklin County, NY CoC – 27
- Wayne, Ontario, Seneca, Yates Counties, NY CoC – 58
- Marquette and Alger Counties, MI CoC – 70
- Livingston County, MI CoC – 77
- Northeast Minnesota CoC – 77
- Chapel Hill/Orange County, NC CoC – 80
Unsurprisingly, the places with the most people experiencing homelessness are major metropolitan areas, all on the West Coast or the Northeast with the exception of Las Vegas. The places with the least people experiencing homelessness are all in rural counties mostly in frigid parts of the country like Minnesota, Michigan, and Upstate New York, with the only urbanized exception of the Chapel Hill/Orange County, NC CoC that is located within the Research Triangle metropolitan area home to the cities of Raleigh and Durham and the eponymous University of North Carolina – Chapel Hill.
From a logical standpoint, these results make sense. Most people experiencing homelessness are located in big cities mainly because that is where housing is generally more expensive and the best opportunities for survival exist. Not only do cities have homeless shelters and services that are uncommon in rural areas, there are also many more people who may donate food or a couple quarters to those down on their luck. On the flipside, the cheaper housing markets in rural areas mean that someone is less likely to be unable to afford shelter. In addition, the sense of community found in small towns may also prevent homelessness in that landlords and neighbors might help out someone struggling with rent before the problem results in eviction. While these statements probably aren’t true for every small town or every city, this line of thought helps explain the disparity with homeless populations between urban and rural areas.
However, I’m not happy with these results because of the major variance between size and population of each CoC. The areas range in size from the smallest, Cambridge, MA CoC (home to Harvard University) at just over 7 square miles, to the largest, Alaska Balance of State CoC (essentially all of Alaska minus Anchorage) at 579,555 square miles! A similarly scaled difference exists when looking at total population, ranging from Garrett County, MD CoC at 27,157 (hmm, this was also the place with the lowest number of people experiencing homelessness) to the Texas Balance of State CoC (Texas minus its large metros) at 9.7 million people.
Furthermore in defense of Los Angeles, the LA CoC covers the entirety of LA County minus the cities of Glendale, Pasadena, and Long Beach which each have their own CoC. Now imagine what comes to mind when you think of LA, it’s probably something like freeways and an endless expanse of city extending in every direction, stopping only at the undevelopable ocean and steep mountains. LA County contains 88 incorporated cities, so subtracting the three independent CoCs means that 84 cities in addition to the City of Los Angeles are included when counting the total number of people experiencing homelessness. Now, is it a coincidence that the LA CoC is #2 overall both in total population and in number of people experiencing homelessness?
Normalizing the Data
Alright, so we need to normalize the data, now that we realize the map essentially said there are a lot of people experiencing homelessness in places where there are a lot of people. This is magnified by the fact that many CoCs encompass entire states or the majority of a state minus its largest metro areas, hence why Wisconsin and Iowa seem to have a major homelessness problem. The following sections will normalize the number of people experiencing homelessness by area in square miles and by total population to better understand the distribution of the problem in the U.S.
Homelessness by Area
The first attempt at normalization calculates the number of people experiencing homelessness per square mile within each CoC, essentially the density of homelessness. The underlying assumption here is that larger areas would have larger populations of people experiencing homelessness, so normalization in this manner would account for the difference in size between CoCs.
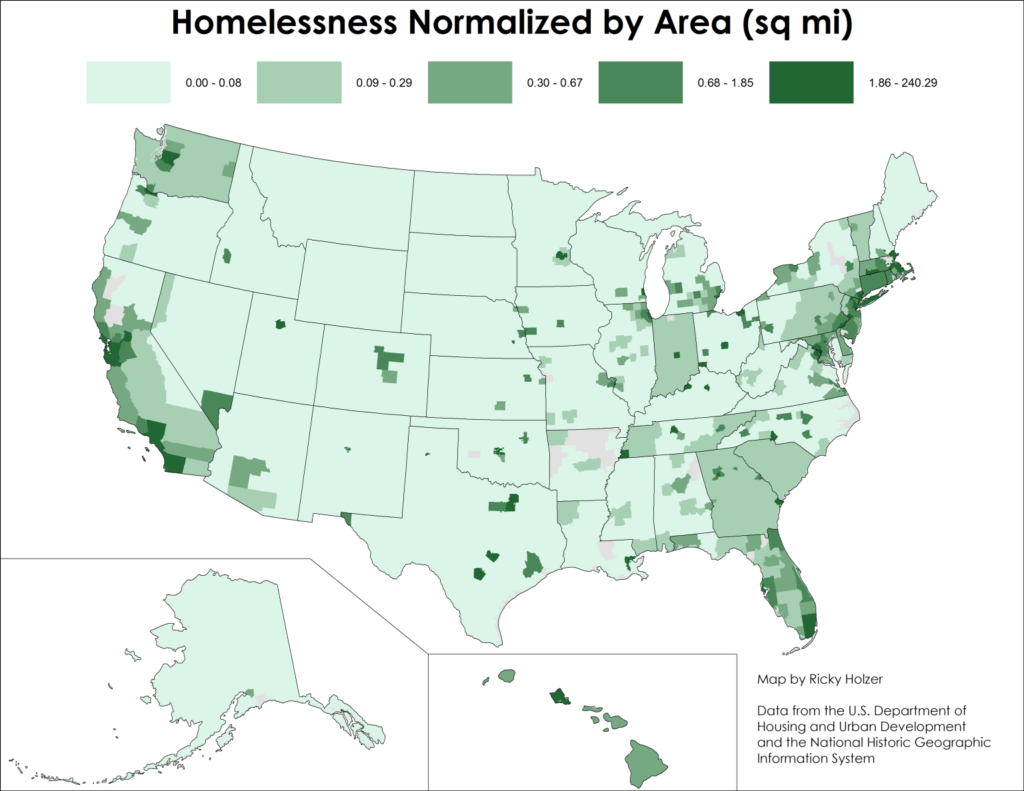
As you can see on the map above, normalizing by area really makes big cities and metro areas pop, so much that I’m sure you can start guessing where your favorite major cities are even if you’re not very good at geography. The anomalies we saw in the previous map with Wisconsin and Iowa disappear, and this map again locates some familiar faces on the west coast, Northeast, and coastal South. Only Indiana remains out of the states in the Rust Belt cluster from the previous map. Large rural and uninhabited areas in the middle of the country have the low incidence of homelessness that is expected, a major change from the previous map.
If we were to normalize the totals for the entire U.S., there would be approximately 0.1 people experiencing homelessness per square mile, meaning that everywhere with the three darkest colors and some of those with the second lightest color have a greater density of people experiencing homelessness than the national average. Given how vast and undeveloped the country is, it’s obvious that 0.1 per square mile is an unfair expectation (except when people are trying to argue with you that LA is most definitely a garbage pit). By averaging the results for each CoC, we get about 4 people experiencing homelessness per square mile. Only some of the results in the darkest color are greater than this amount – 44 CoCs of the total 387 CoCs to be exact. Let’s look at the top and bottom 10 for some more insights about where the problem exists and doesn’t exist:
Most per Square Mile
- New York City CoC – 240
- San Francisco CoC – 148
- Boston CoC – 126
- District of Columbia CoC – 122
- Cambridge, MA CoC – 72
- Lynn, MA CoC – 46
- Long Beach, CA CoC – 43
- Philadelphia CoC – 42
- Lowell, MA CoC – 40
- Baltimore CoC – 33
Least per Square Mile (all less than 0.01)
- Alaska Balance of State CoC
- Nevada Balance of State CoC
- Northeast Minnesota CoC
- Nebraska Balance of State CoC
- Franklin County, NY CoC
- Southeast Arkansas CoC
- New Mexico Balance of State CoC
- Wyoming Statewide CoC
- Alpine, Inyo, Mono Counties, CA CoC
- Utah Balance of State CoC
Boom, Los Angeles didn’t even make the top 10 this time, moving down all the way to #22. The top list consists entirely of cities with small footprints like those in the Northeast, the peninsula of San Francisco, and the City of Long Beach within Los Angeles County. Surprisingly, three suburbs of Boston also appear on the top list, suggesting that Greater Boston has a more widespread homelessness problem. On the bottom list, Franklin County, NY CoC coincidentally ranks #5 exactly as it did in the non-normalized dataset. The bottom list seems logical, listing sparsely populated and largely undeveloped areas in the Mountain West and a smattering of rural places in the Midwest and East.
This clearly isn’t the best measurement to use given that homelessness can only exist where people live, giving CoCs with vast undeveloped areas an underestimated number compared to CoCs that are entirely urban and developed. To account for this, I extracted the block groups with zero population and recalculated the areas for each CoC. As you can see in the map below and the following top and bottom 10 lists, there are some slight changes:
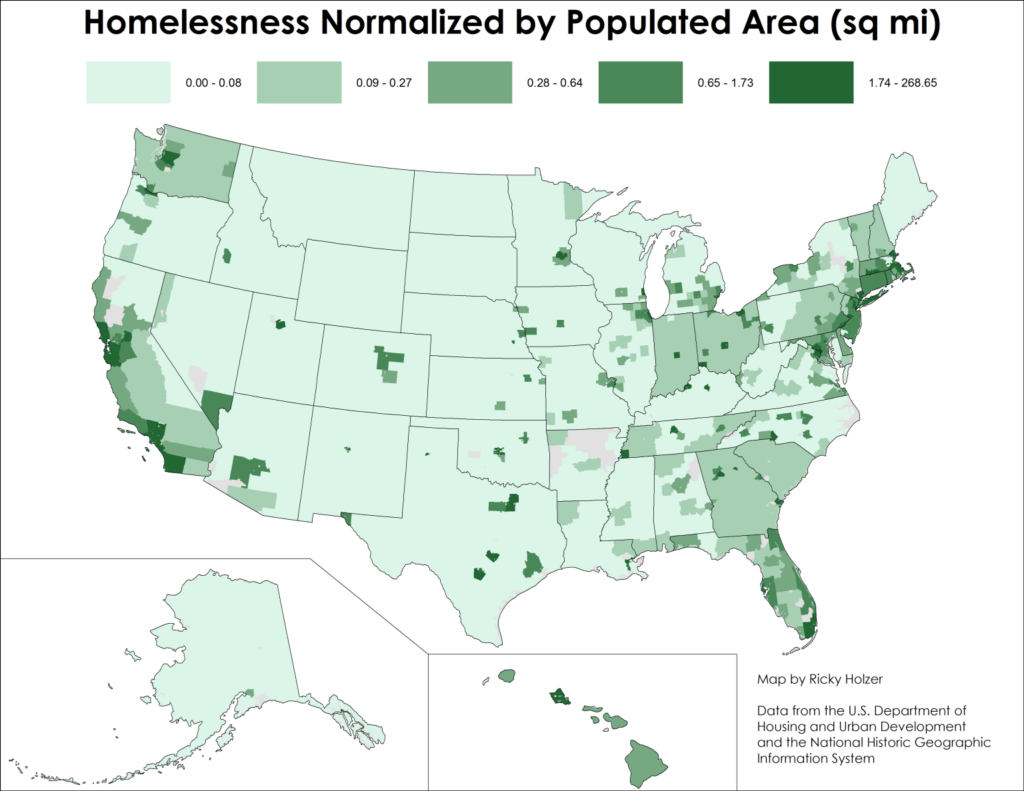
Most per Square Mile
- New York City CoC – 268
- San Francisco CoC – 148
- District of Columbia CoC – 135
- Boston CoC – 133
- Cambridge, MA CoC – 72
- Long Beach, CA CoC – 54
- Lynn, MA CoC – 46
- Philadelphia CoC – 46
- Lowell, MA CoC – 40
- Baltimore CoC – 35
Least per Square Mile (all less than 0.01)
- Alaska Balance of State CoC
- Nevada Balance of State CoC
- Northeast Minnesota CoC
- Nebraska Balance of State CoC
- Franklin County, NY CoC
- Southeast Arkansas CoC
- New Mexico Balance of State CoC
- Wyoming Statewide CoC
- Alpine, Inyo, Mono Counties, CA CoC
- Utah Balance of State CoC
On the map, the Phoenix, Mesa/Maricopa County CoC, the Duluth/St. Louis County, MN CoC, and the Ohio Balance of State CoC all darkened by one shade. The District of Columbia CoC and the Long Beach, CA CoC both moved up in rank, but the bottom list remains the same. I’m still not entirely satisfied by these results though since only a minimal amount of Alaska and Nevada were removed in the process, and I’m positive the uninhabited areas of the country are large enough to have an effect on the bottom list. I’m not sure what data I would use or how I would go about looking at homelessness only in habited areas, but please let me know in the comments if you have any ideas.
Homelessness by Population
The second attempt at normalization calculates the percentage of the population that is experiencing homelessness. The assumption here is that populated places inherently have more people experiencing homelessness and places with fewer people also have fewer people experiencing homelessness.
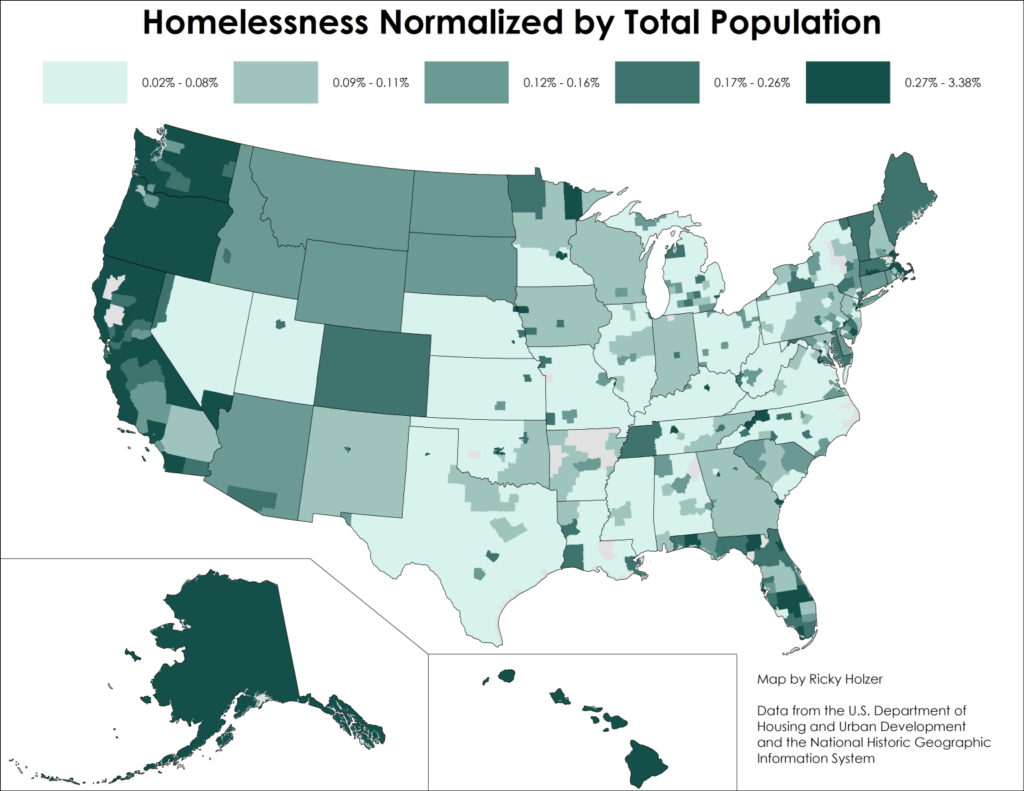
This map looks much more similar to the first map of the raw data than the map normalized by area. Again, the West Coast, Northeast, Florida, and Hawaii have the largest numbers. The most noticeable change comes from rural CoCs in the South and Midwest, showing that although there’s a larger number of people experiencing homelessness in these areas, they also have a larger population in general. Northern Minnesota, the Mountain West, and Alaska all surprised me with their prominence on this map – I had assumed normalization would account for their prominence on the first map.
Framed in the national context as calculated previously, less than 0.2% of the total population was experiencing homelessness in the entire U.S. This means everywhere with the darkest color and some places with the second darkest color are above that national average. Now let’s look at the top and bottom 10:
Highest Percentage of Total
- Monroe County, FL CoC – 3.38%*
- Mendocino County, CA CoC – 1.80%
- District of Columbia CoC – 1.29%
- Hawaii Balance of State CoC – 1.05%
- Boston CoC – 1.04%
- Humboldt County, CA CoC – 1.03%
- Atlanta CoC – 1.01%
- New York City CoC – 0.91%
- Columbia, Hamilton, Lafayette, Suwannee Counties, FL CoC – 0.89%
- San Francisco CoC – 0.88%
Lowest Percentage of Total
- Jamestown, Dunkirk/Cautauqua County, NY CoC – 0.020%
- Wayne, Ontario, Seneca, Yates Counties, NY CoC – 0.024%
- Dearborn, Dearborn Heights, Westland/Wayne County, MI CoC – 0.026%
- Overland Park, Shawnee/Johnson County, KS CoC – 0.027%
- Central Tennessee CoC – 0.028%
- Provo/Mountainland, UT CoC – 0.030%
- Southeast Arkansas CoC – 0.030%
- South Central Illinois CoC – 0.034%
- Bergen County, NJ CoC – 0.035%
- Pontiac, Royal Oak/Oakland County, MI CoC – 0.036%
Looks like LA didn’t break the top 10 once again, this time landing at #29 for those keeping score. The results of the highest per capita list are interesting and definitely places to research further to find underlying causes of the problem. First on the list is the Monroe County, FL CoC, home to the beachy tourist destination Key West, hinting that people experiencing homelessness might relocate there to live by the beach and reap the benefits of generous tourists. I put an asterisk next to this number because I believe it might be an error due to the calculation of population: Monroe County’s population is reported to be 79,077 in 2016 yet the spatial join calculated it at only 17,029, possibly because the CoC boundaries only include the largest islands in the Florida Keys and therefore omit some of the population. Despite this error, using the correct population figure still places the Monroe County, FL CoC at #11 on the top list. If this is in fact an error, this places the Watsonville/Santa Cruz City and County, CA CoC at #10.
The Mendocino County CoC at #2 and Humboldt County CoC at #6, both located on the coast of Northern California, are known for their hippie cultures, which makes me question if the general culture of the area is a reason there are so many people experiencing homelessness and perhaps if some do so by choice. Boston, New York, San Francisco, and Washington, DC have appeared on every list thus far, unsurprising given how expensive housing is in each of these markets. At this point I’m convinced that these cities all have it worse than LA even though they have a lower number of people experiencing homelessness (except for New York). In particular, Greater Boston must have a serious problem because four suburbs of Boston also cracked the top 25.
Atlanta is a new face, but its appearance is most likely due to the fact that the Atlanta metro is highly decentralized and much more of the population lives in the surrounding suburbs than the central city; combine this with the fact that the Atlanta CoC only encompasses the inner city and there are three additional CoCs within the metro, and it becomes more apparent that this is probably the case. This fact further bolsters my hunch that CoC boundaries are more political than practical.
The one odd result is the group of four counties in Florida, a largely rural area wedged between Tallahassee and Gainesville with no coastal access. This makes me wonder whether this part of Florida has some deeper underlying societal problems unknown to the rest of the country. That, or there’s another data error, but that’s unlikely given there is no coast in that CoC, nor is there any other reason the spatial join would have miscalculated the population.
The bottom list has some familiar faces from Upstate New York (important aside, for the small number of people experiencing homelessness, both #1 and #2 reported all as sheltered), and the CoCs from Middle America are no surprise. The two Michigan CoCs at #3 and #10 are both suburbs of Detroit, and my hypothesis is that these numbers are greatly deflated because of the political choice to create separate CoCs from the core city in the metro area. This is the same story as the #4 Overland Park Shawnee/Johnson County, KS CoC, a suburb of Kansas City, and the Bergen County, NJ CoC, a suburb of New York and one of the wealthiest counties in the U.S. (but just because they have money doesn’t mean they have taste). The final member of the list, the Provo/Mountainland, UT CoC which is home to Brigham Young University as well as ski resorts and the Sundance Film Festival in Park City is also a relatively wealthy area outside of Salt Lake City, but I’m not going to be as critical of the potential political reasons behind these CoC boundaries because the Salt Lake City CoC has an impressive 97% shelter rate for its over 1,800 people experiencing homelessness.
One thing to consider is that it is unlikely that many people experiencing homelessness were included in the population counts, especially when you consider that the method of collecting this information is mail in survey and that many people experiencing homelessness would be unwilling or unable to complete a survey even if they could receive one. As an experiment, I created an “adjusted population” of the original total population plus the number of people experiencing homelessness, then recalculated the percentage of people experiencing homelessness of the population. The effect was in the magnitude of only hundredths and thousandths of a percentage point, and thus the rankings from top to bottom didn’t change.
On Defending Los Angeles
Maybe I’ve proved that Los Angeles doesn’t have it as bad as some other cities, but at the same time I don’t want to downplay the ridiculously high number of people experiencing homelessness in LA, approximately 10,000 more people than the entire population of Beverly Hills (which is also one of the cities within the CoC). However, I will admit that LA is the worst major city for providing shelter (technically Fresno is worse, but who cares about Fresno), with only 25% of people experiencing homelessness being sheltered, #15 from the bottom out of all CoCs. Actually, looking at the bottom of the list of percentage sheltered, a majority of the CoCs are in California:
- Alpine, Inyo and Mono Counties CoC – #3
- Mendocino County CoC – #6
- Humboldt County CoCs – #7
- San Luis Obispo County CoC – #8
- Tuolumne, Amador, Calaveras, and Mariposa Counties CoCs – #11
- Fresno City and County/Madera County CoC – #13
- Redding/Shasta, Siskiyou, Lassen, Plumas, Del Norte, Modoc, Sierra Counties CoC – #14
- Los Angeles City and County CoC – #15
- Yuba City and County/Sutter County CoC – #16
- Vallejo/Solano County CoC – #18
- San Jose, Santa Clara City and County CoC – #19
And that just includes those in the bottom 20! Even worse, California has 26 of the bottom 50 shelter rates among all 387 CoCs and there are only 41 CoCs in the state (so I can easily say over half of the state is actually the worst). Here I spent all this time defending LA, and it turns out both LA and California are giant piles of garbage when it comes to housing people experiencing homelessness. My theory is that everyone in California believes the weather is so nice they don’t feel guilty when thousands and thousands of people have to sleep unsheltered every night.
One might argue that LA is doing an ok job considering that it provides shelter for nearly double the number of people experiencing homelessness than Chicago’s total number of people experiencing homelessness, sheltered or not. In such an expensive real estate market, it’s not an easy feat to build this type of housing, especially when you consider the contentiousness of building anything in LA. The perfect counterargument here is the New York City CoC, which has 73,523 people experiencing homelessness while maintaining a 96% shelter rate, meaning that New York houses over 6 times more people each night (and real estate ain’t cheap there either). Cold weather cities really dominate LA’s shelter rate, with the District of Columbia CoC also maintaining a 96% shelter rate with 8,032 people experiencing homelessness, and the Boston CoC having a 97% shelter rate with 6,240. Though I previously stated New York, Boston, and DC all have worse homelessness problems than LA, it seems that those places have the problem more under control, at least in terms of shelter.
Even a few places in warm climates have a respectable shelter rate, so maybe Californians are just heartless: Orlando/Orange, Osceola, Seminole Counties, FL CoC with 92% for 1,670; El Paso City and County CoC with 90% for 1,100; Albuquerque CoC with 85% for 1,222; Tucson/Pima County CoC with 78% for 1,765; and Miami-Dade County CoC with 77% for 4,235. While those places might be warm enough on a January night that someone wouldn’t die from sleeping outside, experiencing homelessness isn’t a camping trip and shelter is still a necessity (take a walk down Skid Row then convince me you wouldn’t mind sleeping there). Get it together California!
Conclusions
What have we learned here today? First and foremost, normalization is highly important when analyzing any sort of data, and its absence can greatly skew our perceptions. Secondly, homelessness is mainly an urban problem, though it is also prominent in more rural areas on the West Coast (including both Alaska and Hawaii), Florida, and in the Northeast. Thirdly, colder cities in the Midwest and Northeast are much more likely to provide shelter to people experiencing homelessness than almost anywhere on the West Coast. Finally, while the scale of homelessness in Los Angeles is not as bad relative to other cities in the country, it does a dismal job in housing people experiencing homelessness.
References
Steven Manson, Jonathan Schroeder, David Van Riper, and Steven Ruggles. IPUMS National Historical Geographic Information System: Version 12.0 [Database]. Minneapolis: University of Minnesota. 2017. http://doi.org/10.18128/D050.V12.0